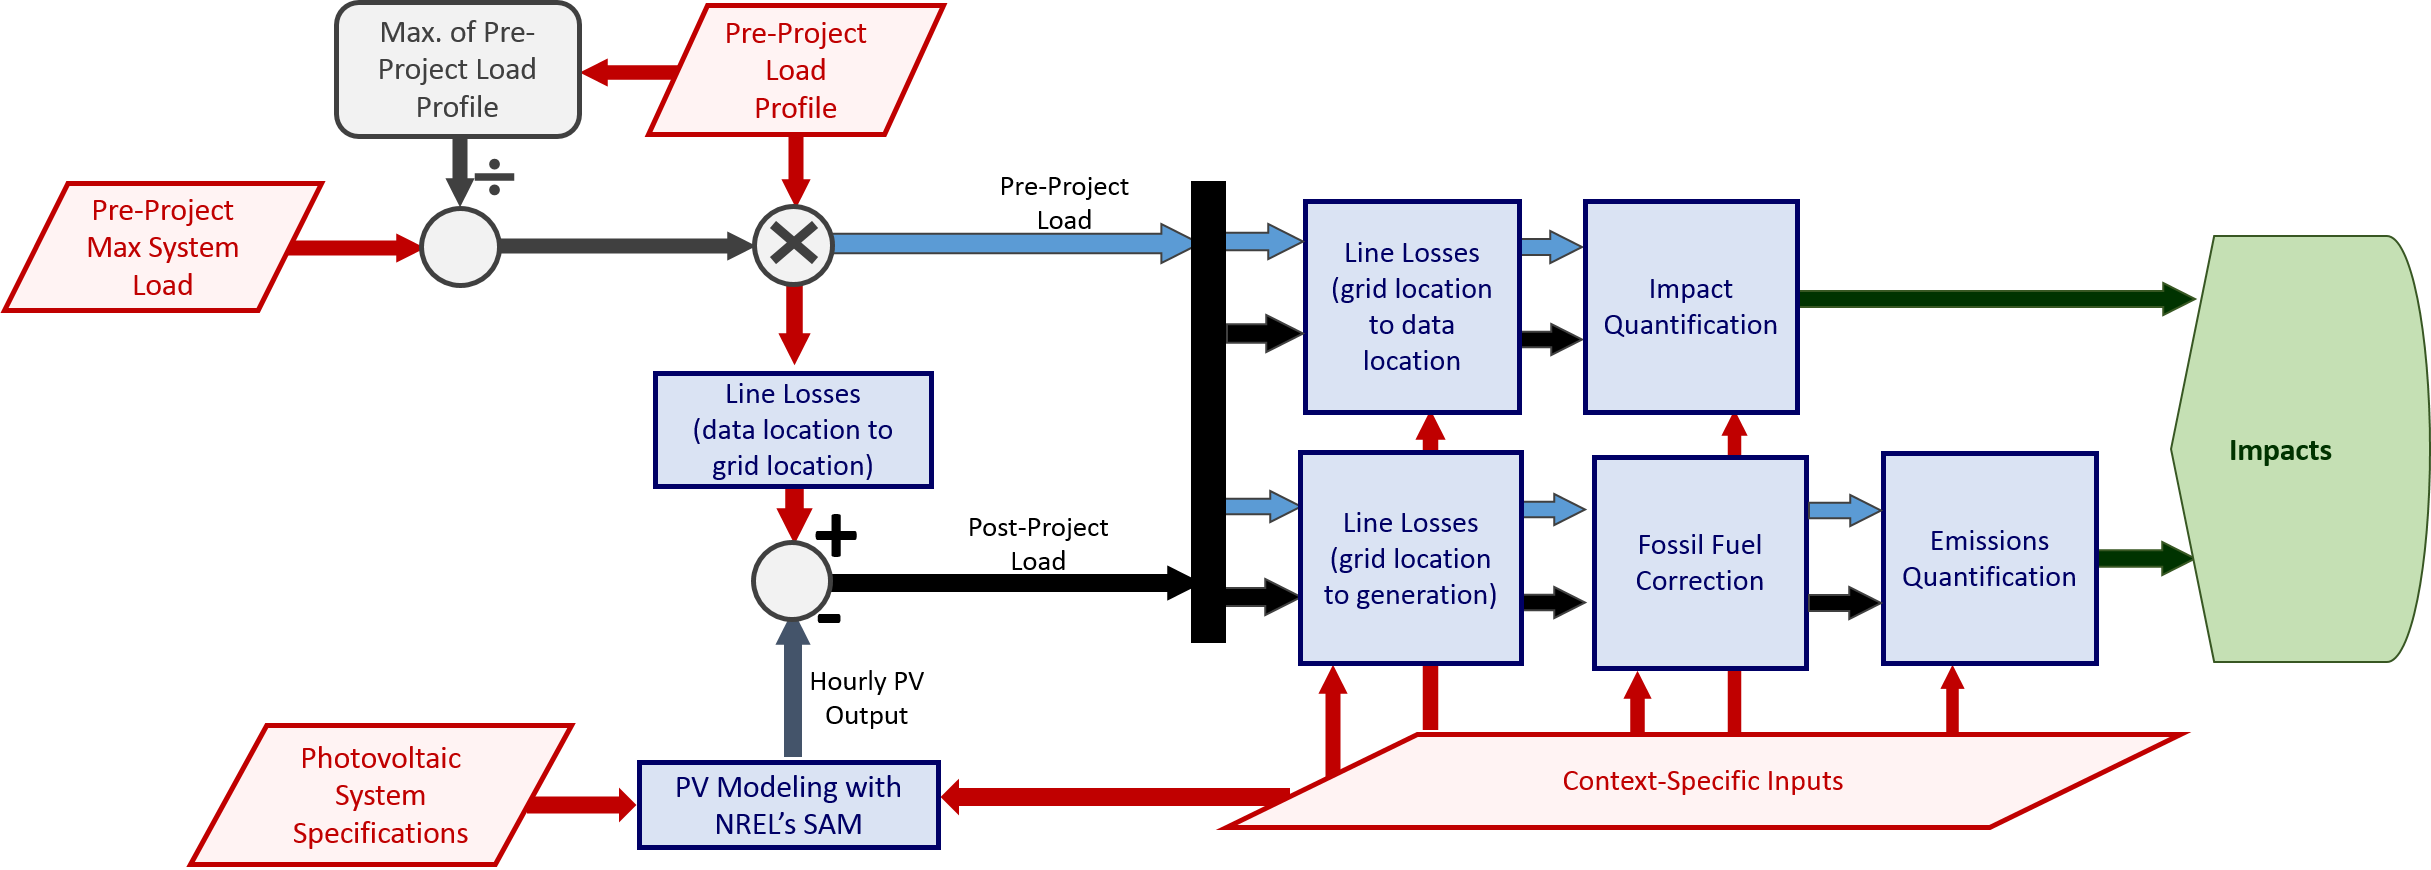
The PV Data Modeling project provides users with the opportunity to model the output of their PV project and then determine the impact on the regional load shape. GridPIQ leverages NREL’s System Advisor Model (SAM) tool to do this modeling by using a local version of the SAM Simulation Core (SSC) software development kit (SDK). The post-project load is found simply by subtracting the PV system’s average hourly AC power output from the average hourly regional load. The flow chart below illustrates the workings of this module.
Photovoltaic System Weather Location
NREL's SAM tool requires hourly solar resource data that describe the solar radiation and weather conditions at the system's location in order to model the PV system's output. To provide these data to SAM, GridPIQ provides the user with a selection of typical meteorological year (TMY) data from weather stations across the world. These TMY data sets have been taken from the NREL National Solar Radiation Database (NSRDB). Within the NSRDB there are two sets of TMY data: TMY2, which is derived from historical data from 1961-1990, and TMY3, which is derived from 1991-2010 data.Photovoltaic System DC Capacity
The photovoltaic system direct current (DC) capacity dictates the total nameplate capacity of all the PV modules that make up the system. This is the amount of DC electricity that the modules will produce under standard test conditions (STC), which are a solar irradiance of 1,000 W/m2, a cell temperature of 25°C (77°F), and an air mass of 1.5. The National Renewable Energy Laboratory's SAM tool requires that DC capacity be given based on STC, and so the user is advised not to provide a DC system size based on other test conditions.PV Module Type
The options for PV module type are defined by NREL's SAM tool. The selection dictates how SAM calculates both the angle-of-incidence correction factor as sunlight passes through the module cover to the photovoltaic cell and the cell's operating temperature. The nominal module efficiency, cell material, and temperature coefficient from the module data sheet can be used to choose the module type. Otherwise, the default Standard module type is a reasonable choice for most crystalline silicon arrays.| Type | Approximate Efficiency | Module Cover | Temperature Coefficient |
|---|---|---|---|
| Standard | 15% | Glass | -0.47 %/°C |
| Premium | 19% | Anti-reflective | -0.35 %/°C |
| Thin Film | 10% | Glass | -0.20 %/°C |
PV Array Type
The PV array type indicates the racking solution for the PV modules and whether the array is fixed or tracks the movement of the sun. NREL's SAM tool has five PV array type options:Fixed (open rack): A stationary (non-tracking) array installed in a location where air flows freely around the array. This is typical for a ground-mounted system.
Fixed (roof mount): A stationary (non-tracking) array installed on a roof or other location where air flow is limited around the modules. This can decrease performance by increasing cell temperature.
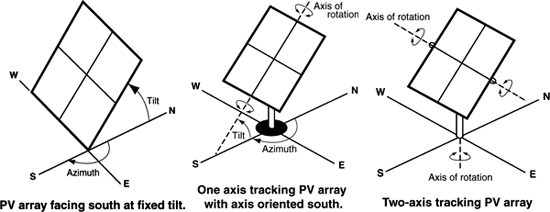
1-Axis Tracking: An array that rotates around one axis, which is defined by the tilt of the array as depicted in the figure below.
1-Axis Backtracking: A 1-axis tracking array that includes a backtracking algorithm, which rotates the array toward the horizontal during early morning and late evening hours to reduce the impact of self-shading.
2-Axis Tracking: An array capable of tracking along both the azimuth and tilt dimensions of the array as depicted in the figure below.
The default for this input is set to Fixed (open mount) for consistency with NREL's PVWatts® tool.
PV System Losses (%)
The PV system losses account for the performance losses of a real system that are not explicitly calculated by NREL's SAM tool. Losses that occur in the DC-to-AC conversion are accounted for using the PV inverter efficiency input and modeled using typical efficiency curves. Temperature-related losses are calculated as a function of the cell temperature and should therefore not be included in this parameter. GridPIQ uses the same default loss value of 14% that is incorporated into NREL's PVWatts® calculator. A breakdown of this value is provided in the table below.| Category | Default Value (%) |
|---|---|
| Soiling | 2 |
| Shading | 3 |
| Snow | 0 |
| Mismatch | 2 |
| Wiring | 2 |
| Connections | 0.5 |
| Light-Induced Degradation | 1.5 |
| Nameplate Rating | 1 |
| Age | 0 |
| Availability | 3 |
PV Module Tilt (degrees)
The tilt angle applies to both fixed and one-axis tracking array types and describes the angle from horizontal of the PV modules that make up the array. A tilt angle of 0° would indicate that the array was directly horizontal (or level) while an angle of 90° would indicate that the array was vertical (or perpendicular to a level surface). For consistency with NREL's PVWatts® calculator, the GridPIQ defaults to a 20° tilt for fixed arrays and a 0° tilt for one-axis tracking arrays.PV Module Azimuth (degrees)
The PV module azimuth applies to both fixed and one-axis tracking array types. For a fixed array, the azimuth describes the the direction that the array faces and is given in degrees clockwise from true north. An azimuth angle of 0° therefore indicates the array is facing directly north while an azimuth angle of 180° faces due south. The azimuth angle is similar for a one-axis tracking array, except that the angle described is relative to the axis of rotation. The default azimuth angle is 180° (south-facing) as this typically maximizes array output over the year for systems in the northern hemisphere. However, local weather patterns may cause the optimal azimuth angle to be slightly more or less than the default value.DC to AC Ratio
The DC to AC size ratio is the ratio of the inverter's AC rated output to the total PV array's DC rated capacity. The default value is set to 1.10 to be consistent with NREL's PVWatts® tool. A DC to AC ratio of greater than one indicates that the DC capacity of the PV system's modules is greater than the rated AC output of the sytsem's inverter(s). A 10 MW DC PV system with a DC to AC ratio of 1.1 would have an AC output of 9.09 MW.For a system with a high DC to AC size ratio, during times when the array's DC power output exceeds the inverter's rated DC input size, the inverter limits the array's power output by increasing the DC operating voltage, which moves the array's operating point down its current-voltage (I-V) curve. NREL's modeling tools account for this effect by limiting the inverter's power output to its rated AC size.
NREL reports that the typical range for the DC to AC ratio is from 1.10 to 1.25, although in large scale systems, this value can be higher, typically up to 1.50. GridPIQ limits user inputs to a range of 0.4 to 2 for continuity with NREL's PVWatts® modeling tool.
PV Inverter Efficiency (%)
The PV inverter efficiency is the rated AC power output of the inverter divided by its rated DC power input. This is a nominal equipment specification provided by the inverter manufacturer. Both the default value of 96% and the acceptable range of values between 90% and 99.5% are consistent with NREL's PVWatts® calculator. NREL's tools calculate the inverter's hourly operating efficiency by coupling this nominal value with typical efficiency curves.PV Ground Coverage Ratio
The ground coverage ratio (GCR) is used in modeling only arrays with one-axis tracking, which includes both the 1-axis tracking and 1-axis backtracking array types. The GCR defines the ratio of the module surface area to the area of ground that the array occupies. A GCR of 0.5 means that when the modules are horizontal (or level) half of the surface below the array is covered by the modules. A GCR of 1 indicates that there is no space between the modules, and a GCR of 0 means that there is infinite space. This parameter is important because shading can occur between neighboring rows of modules in arrays of this type, and so SAM uses the GCR to estimate the losses due to this shading. The default value on the tool has been set to 0.4 to reflect the default in NREL's PVWatts®, which states that typical values range from 0.3 to 0.6.